In First blogging swag, I mentioned getting a pre-production prototype of the Bitscope DP01 Dual Channel Active Differential Probe:
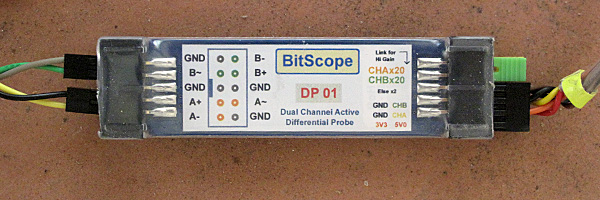
The probe PC board is about 6.2cm long and 2cm wide—8cm long with the connectors on the ends. (More pictures in First blogging swag)
Because the first one they sent me got lost in the mail, I didn’t get this device until the Fall quarter had started and I had a lot of grading to do every weekend (plus trying to rewrite the bioengineering and bioinformatics curricula, but that’s a subject for a different blog post). This weekend I finally have a long weekend without grading (I’ll pay for that next weekend, with a double or triple load), so I’m going to indulge myself and play with my new toy.
The BitScope folks have not released a full spec sheet for the device yet, but they have a blog post with the essentials (and now the official DP01 web page):
DP01 | Active Differential Probe Specifications
| Feature | Specification |
| Attenuation/Gain Ratios | 2:1 & 1:5 (prescale on) |
| Input Bandwidth | DC to 10MHz (-3dB, prescale off) DC to 3MHz (-3dB, prescale on) |
| Common Mode Rejection | 100Hz: >1,000 : 1 1MHz: > 400 : 1 |
| Input Resistance | 20MΩ (differential) 10MΩ (common) |
| Input Capacitance | 2.5pF (differential) 5pF (common) |
| Maximum Working Voltage | 12.5Vp-p (differental) ±13.8Vpeak (common) |
| Power Requirement | 5V & 3.3V (provided by BitScope) |
The bandwidth for the probe is probably larger than the bandwidth for the BS10U Pocket Analyzer itself, and low-voltage measurements will be limited by the noise floor of the pocket analyzer. Let’s start by looking at the pocket analyzer with shorted inputs, to see what the noise floor is:
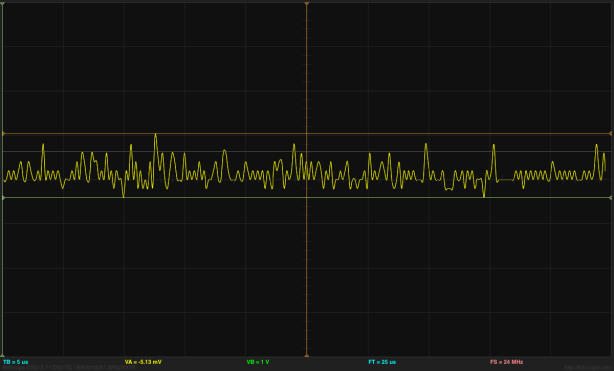
Here is the waveform for the shorted inputs at the highest gain the BitScope provides (10mV/division) at a fairly high sampling rate (5µs/division). The peak-to-peak noise is about 14mV, and the digitization noise (about 2mV/step) is clearly visible. (Click to embiggen.)
For those who have taken my classes and know how I rail against the insanity of black backgrounds and unlabeled axes for plots, I apologize, but BitScope still provides only this 1950s style display, even with the development version of the software (DSO 2.7 DG17G). I wish they would produce publication-quality displays (in svg or pdf formats, with no black background), but I suspect that they have only electrical engineers on their development team, with no graphic designers or human-computer interface experts. It would do them a world of good to read Tufte’s books or some other basic introduction to displaying information.
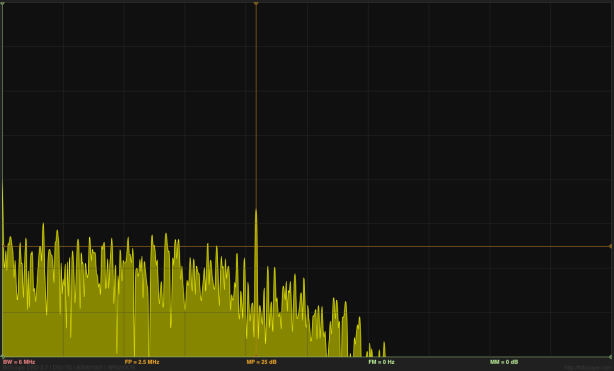
Click to embiggen. Here is the “spectrum” display of the waveform in the previous image (BS10U Pocket Analyzer with shorted inputs). The vertical scale is 10dB/division, and the horizontal scale is 0.6MHz per division (what an awkward unit!). It would be really nice if there were an option to get a log scale on frequency, as is done on Bode plots.
The big spike marked with the vertical orange line is at 2.5 MHz, and is pretty consistently present. The horizonal orange line is at 25dB, and the vertical axis is 10dB/division.
The noise seems to be low-pass filtered at about 2 or 2.5MHz (it’s a little hard to tell, since there is no way with the Bitscope sample to take a really long sample and smooth out the random fluctuations), dropping about 120dB per decade above the cutoff. That would be 6th-order filter, which seems a little high order for an anti-aliasing filter. More likely, they are using a lower-order elliptic filter, Chebyshev filter, or other design with a sharp transition between the passband and the stopband. That might also explain the peaking at 2.5MHz, though the peak seems too sharp to be a filter artifact. Using just the amplifier input noise to probe the filter does not give me much information about the filter once it starts attenuating, so I don’t know what the stop band looks like.
Unfortunately, “The spectrum magnitude display is unreferenced; all measurements are relative to the prevailing V/Div value on each channel” (http://www.bitscope.com/software/dso/guide/2.5/?p=spectrum), so I don’t know what 25dB means here in terms of the actual noise density. A 350mV peak-to-peak sine wave is 60dB at 100mV/division, and 80dB at 10mV/division, so 25dB at 10mV/division would be about 600µV peak-to-peak or 220µV rms for a sine wave. I’m too lazy to try to figure out the rms V/√Hz noise density.
Adding the differential probe in front of the Pocket Analyzer does not change the spectrum shape noticeably.
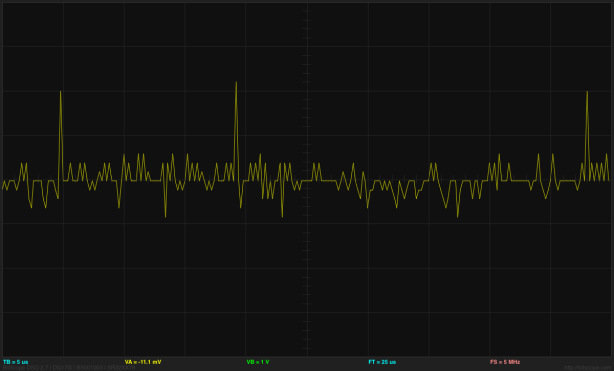
Waveform (using sharp, raw data display) at 5µs/division and 2mV/division of shorted inputs to the DP01 differential probe at high gain (supposedly a gain of 5). (click to embiggen)
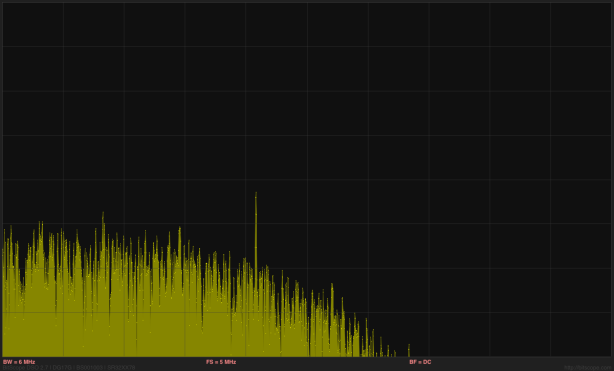
The spectrum (using the sharp, raw data display) looks essentially the same as without the DP01 probe. Note how sharp the 2.5MHz peak is in this view. The limitations of the Pocket Analyzer mask any limitations of the DP01 probe. (click to embiggen)
In the high-gain mode, the probe has a gain of 5 and the input-referenced noise is around 6mV peak-to-peak, instead of 14mV peak-to-peak without the probe. In the low-gain mode (gain of 0.5), the input-referenced noise is about 26mV peak-to-peak (4 different quantization levels). There is noise added by the probe in the high-gain mode, but it is still better than the Pocket Analyzer without the probe (about 7dB better signal-to-noise ratio, though a gain of 5 should produce a 14dB gain.
I looked at the output of my Elenco Model FG-500 function generator with about a 292kHz waveform (80mV peak-to-peak with about a 4.1v DC offset): one channel set to high gain with AC coupling, the other set to low gain with DC coupling and mean-subtraction in software.
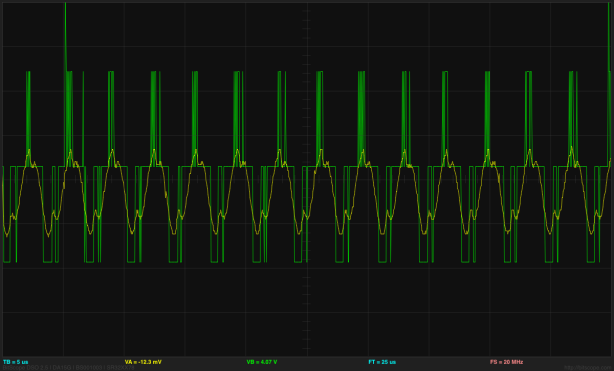
With high gain and AC coupling (yellow), the 292kHz ~80mV signal is easily seen, but with DC coupling (green) the gain has to be turned down to get enough range, and then the low resolution of the BitScope’s ADC is a problem. (click to embiggen)
The glitches in the “sine wave” output of the FG-500 function generator are actually much bigger than they appear here. With my 60MHz Kikusui COS 5060 analog oscilloscope, I can see a downward spike from the top of the sine wave of about the same magnitude as the sine wave in about 30nsec—much faster than the BitScope Pocket Analyzer can capture.

Spectrum at 20 mv/division shows the harmonic distortion and a clear 20dB larger noise floor for the low-gain signal than the high-gain, AC-coupled signal. (click to embiggen)
So far, I’ve just been looking at the probe as an amplifier, without taking advantage of the differential inputs.
I did a simple test with the Freedom KL25Z board (which has a 12-bit DAC), outputting 17 values (0, 0x200, 0x400, … 0x2000), where the full range of the DAC is 0, 0x10, …, 0xfff0. I used a series resistor and capacitor as a load, and measured the voltage across each. Since both the Freedom board and the BitScope are being powered from the same USB supply (my laptop), having differential inputs really reduces the risk of possibly shorting a signal to ground, and allows me to measure the voltage across the capacitor and the current into it simultaneously.
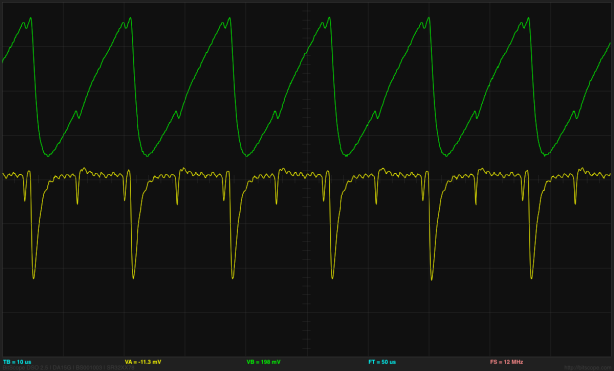
I connected a 470pF capacitor and a 1802Ω resistor in series as a load for the KL25Z 12-bit DAC, and measured the voltage across each. Channel 1 in yellow is the voltage across the resistor.
Channel 2 in green is across the capacitor. As expected the current through the resistor is the derivative of the voltage across the capacitor, but why the small spikes as well? (click to embiggen)
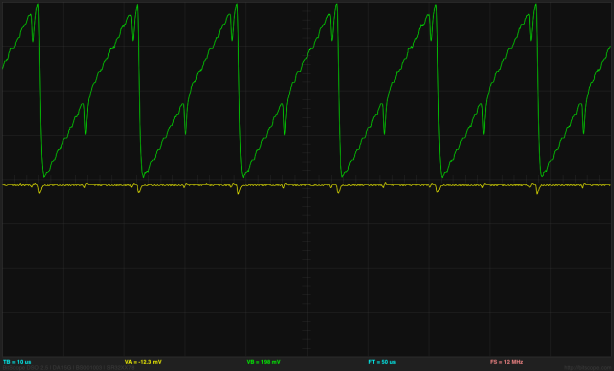
(click to embiggen) With the capacitor removed, the current drops to 0, and the voltage shows bad behavior for the DAC when it switches from 0xe00 to 0x1000 and from 0x1e00 to 0x2000.
I checked, and there are similar problems at all the multiples of 0x1000, even coming from just one count lower.
The KL25 specs call for a settling time of <1µs for single steps and <30µs rail-to-rail. I’m seeing a faster slew than that for large changes (about –3V/1µs slew rate), but the glitch at the multiples of 0x1000 is almost a microsecond long, so is pushing against the code-to-code spec.
Incidentally, it looks like I can output values to the KL25 DAC at about 828kHz with the mbed libraries (using write_u16(), not their ridiculously slow floating-point output routine). Given the 1µs settling time, there isn’t much point to trying to push it faster than that.
Overall, the DP01 seems like a useful tool, compensating for many of the weaknesses of the BitScope Pocket Analyzer. The AC coupling, the differential inputs, and the increased gain are all useful features. There are some flaws, though:
- Changing between differential and AC-coupled input by changing the orientation of the connectors is annoying, and it is very easy to connect things up wrong.
- Having to use shorting plugs to change the gain is also annoying—especially since the labels on the pre-preduction release I have suggest a different arrangement of the shorting plugs than the one that actually works. See the picture at the beginning of this post—the plugs have to be horizontal, with channel 2 on top, but the label suggests that they are vertical, with channel 1 on the outside. Of course, the label also suggests that the gain is ×2 and ×20, rather than ×0.5 and ×5—I hope that they fix that confusion in the final release.
- Having to remember to change the gain setting on the software every time the gain is changed is also annoying. A more integrated system would communicate the gain settings of the probes to the software automatically (difficult to do through the Pocket Analyzer, though, since it has no communication with the probe other than power and measuring the analog output).
Overall, I’m moderately pleased with the BitScope hardware, but I still find their software poorly designed and poorly implemented. Plots have unlabeled axes, cursors can’t be nudged with arrow keys, and numbers can’t be typed in—everything has to be done by microscopic movements of a mouse, which is doubly difficult on a laptop trackpad. I had several array-out-of-bounds crashes today, and the few cryptic labels that are on the plots are often wrong (changing the time base does not update the frequency computation for “FP”, for example).
I’m considering using the DP01 preamplifier before the analog-to-digital converters on the Freedom KL25Z board. I may not get all the flexibility of the BitScope that way, but the 16-bit ADC may compensate for a lot of problems. I should be able to get down to a resolution of 10µv that way, which may be enough to do an EKG recording without an additional amplifier. Unfortunately, I won’t be able to view traces easily, as I’ve not yet gotten my son to rewrite the Arduino Data Logger to talk with the KL25Z board—he’s been spending all his programming time on his light gloves project, and when I can get his attention, it is usually to insist that he work on his college application essays.


[…] I made a table of measurements using the Bitscope cursors (a rather tedious method, but my son hasn’t made the Data Logger code for the Freedom KL25Z yet, and I’m too lazy to do it myself). The Bitscope showed considerable distortion of the 500kHz signal (not evident on a higher-bandwidth scope, so probabably due to the limitations of the BitScope amplifier—see my post on the Bitscope differential probe). […]
Pingback by More on automatic measurement of conductivity of saline solution | Gas station without pumps — 2013 December 21 @ 17:48 |
[…] Today in the mail I got the second swag as a result of my blogging. (The first was a prototype of the Bitscope DP01 active differential probe, which I blogged about in First blogging swag and Bitscope differential probe). […]
Pingback by Build a better life by blogging | Gas station without pumps — 2015 January 27 @ 18:27 |