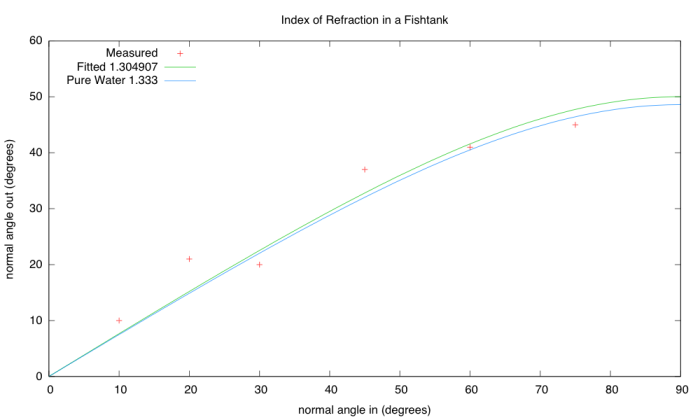
We are way behind on physics—my son took the AP C: E&M test before we even got to Faraday’s Law. He read through the last 3 chapters of Matter and Interactions in 3 days, rather than the 8 weeks we had originally planned, and he hasn’t done any of the exercises in those chapters yet. Because he is planning to take the SAT 2 Physics test this Saturday, I decided that he should at least have a cursory familiarity with Snell’s Law. Since there wasn’t time or energy for a problem set, we did a lab instead.
I had noticed when playing around with the violet (405nm) laser pointer, that the water in the fish tank fluoresced brightly.

Laser beam causing fluorescence of water in fish tank. The beam comes in from the right and is reflected off the water-air interface.
The blue is probably from bacterial cells in the water, and the red from chlorophyll from algae growing on the walls of the tank. We get the blue fluorescence even from water right out of the tap, though not as brightly.
We made some very crude measurements of the angle of the beam coming into the water and of the beam in the water using a protractor. (The beam coming in was invisible in the air, so measuring the incoming angle was very inaccurate.)

Despite the very inaccurate measurements, my son got a decent estimate of the index of refraction of the water. We don’t know the true index of refraction, since the water has a lot of “stuff’ in it.
Here is the gnuplot script he used for fitting the data (with some editing by me, which he did not entirely approve of):
set angle degrees

set xrange [0:90]
set yrange [0:60]

set title 'Index of Refraction in a Fishtank'
set key top left
set xlabel 'normal angle in (degrees)'
set ylabel 'normal angle out (degrees)'

refract(a_in, rfr_ind) = asin(sin(a_in)/rfr_ind)

water_rfr = 1.333
fishtank_rfr = 1 # initial guess

fit refract(x, fishtank_rfr) 'snell1.gnudat' using (90-$1):(90-$2) via fishtank_rfr

plot 'snell1.gnudat' using (90-$1):(90-$2) title 'Measured', \
    refract(x, fishtank_rfr) title sprintf('Fitted %f', fishtank_rfr), \
    refract(x, water_rfr) title sprintf('Pure Water %.3f', water_rfr)
I’m sure that with more careful measurement, we could get much less scatter around the theoretical curve, but we were tired at the end of the day and couldn’t be bothered to do the measurements right.


