Gas station without pumps

2017 November 17

Tape sensors

Filed under: Robotics — gasstationwithoutpumps @ 15:06
Tags: , , , ,

One of the requirements of the robot for Mechatronics is that it have optical sensors on the bottom to detect black tape on a white background, for detecting the edges of the field, alignment marks for the Ren-ship target, and other marks on the field that seem to be there just to be a nuisance and make the state-machine design harder.

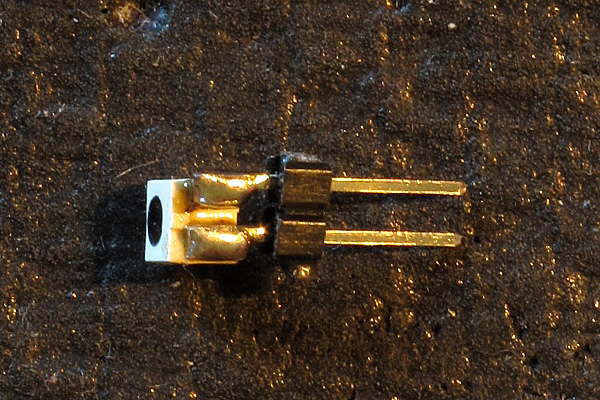
We were issued a number of TCRT5000L reflective sensors, which consist of an IR emitter and a phototransistor in a plastic package that is optimized for a surface 2mm away.  Although the sensors are designed to snap into PC boards and could probably be snapped into carefully sized holes in MDF, I’ll be mounting them on perfboards, which will be screwed onto the top of the baseplate of my robot, with rectangular holes in the MDF for the sensor to poke through.  They’ll barely poke through (6mm high — 5mm MDF), which means they’ll be about 7mm from the floor.  At that distance, the collector current is about half what it would be at the optimum distance.  The MDF provides some extra shrouding from stray light from the sides, which should help with detection.

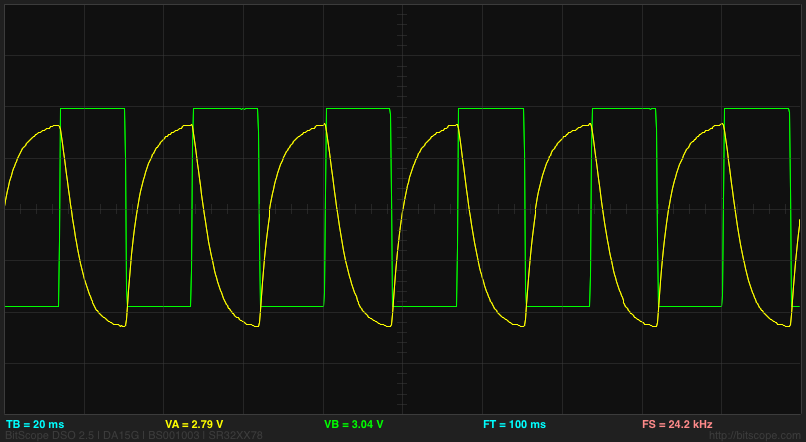
I’m planning to turn the IR emitters on only when I need to read the sensors, to save power and to allow synchronous detection of reflectance (looking at the difference in light levels between the IR emitter being on or off).  By keeping the duty cycle below 50%, I can run the IR emitters up to 50mA, though I may not need them to be that bright.

If I switch on 5 IR emitters at once, at 50mA each, I’ll be  using 250mA, which is the limit for what I could get from the Teensy 3.2 3.3V regulator (rated for 250mA, though that’s a thermal limit, so 500mA may be available for low duty cycle) and far exceeds the 100mA limit for Teensy LC or Teensy 3.1 boards.  I will be using a 5V regulator to power the Teensy boards, so I could use the 5V supply to power the IR emitters also.

If I use only 10mA per IR emitter, I only need 50mA total and so could power off of either 3.3V or 5V.

For 50mA at 5V, I’d need a current-limiting resistor of ≥(5V–1.2V)/50mA=76Ω, so an 82Ω resistor for 46–48mA would work.  For 10mA at 5V, I’d need ≥(5V–1.1V)/10mA=390Ω, and for 10mA at 3.3V, I’d need ≥(3.3V–1.1V)/10mA=220Ω.

I have a couple of choices for wiring up the sensors:

There are 3 wires to each sensor board, but only the current output is unique to the board—the IR emitter connections can be shared among all sensors.

Low-side switching only requires an nFET, but the power connection for the IR emitter is limited to 3.3V. High-side switching keeps the 3.3V power line from being routed near the motors, but requires a 5v-powered inverter to get a sufficiently large voltage to shut off the pFET.

The expected current from a white background @7mm is about 400µA for 10mA input or 2mA for 50mA input, assuming VCE is in the active region (above about 0.5V).  If I’m looking for a 1V swing between dark and light, I’ll want about 2.5kΩ for the sense resistor for a 10mA input and 500Ω for a 50mA input.

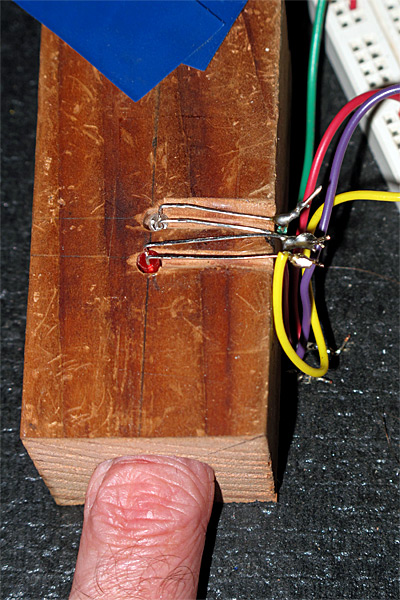
I did a couple of tests with the TCRT5000L using the low-side switching configuration, with 3.3V and a 220Ω current-limiting resistor.  I was doing the tests in a well-lit room (my breakfast room on a sunny day, but without direct sunlight in the room), so the background light is probably brighter than the robot will ever have to deal with.  I used one of the wheels from the MockRobot to be the target, since I could put a screw through the axle hole to get a more-or-less consistent spacing from the sensor.  I adjusted the nut so that the spacing was about 7mm from the sensor, but the angle was only controlled by eyeballing the levelness of the target, so probably varied by ±10°. I did not have any of the black tape that was used on the fields, so I substituted black electrical tape, which I think may be slightly more reflective.

I initially tried 2.7kΩ as the sense resistor, but after seeing the voltage range for that, I upped it to 5.1kΩ.

With 5.1kΩ, the voltages when illuminated are very different between black and white—a simple digital input would suffice.

The currents can be seen to be about the same, independent of the sense resistor, with the white MDF giving about 10 times current of the black electrical tape. The signal from background illumination is insignificant, though that might not be true if the IR beacon is lighting up the field.

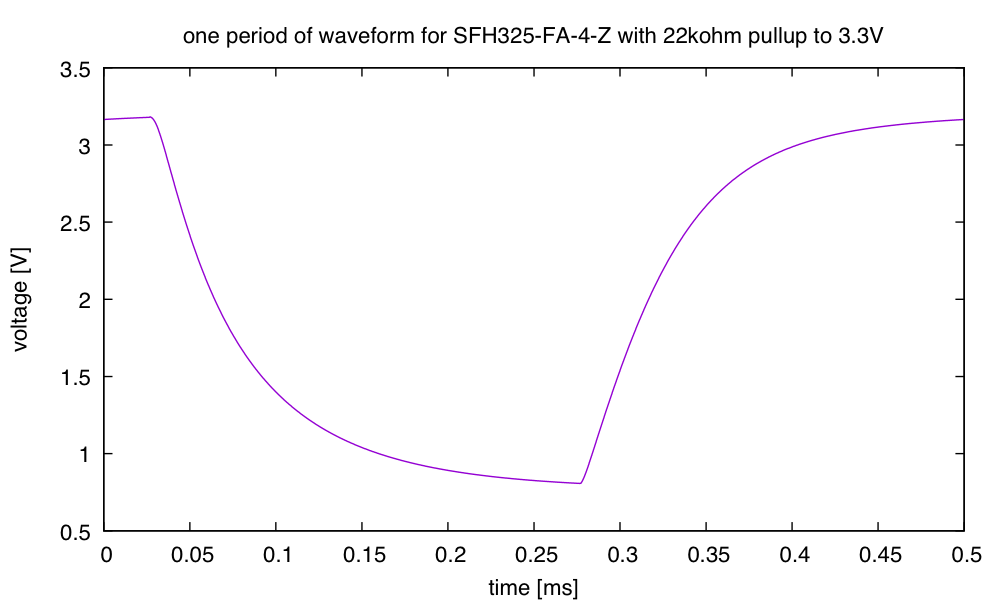
It looks like 10mA (measured as 9.65mA) is more than enough light for the sensors to tell black from white, and that the signal is strong enough that I don’t really need analog input or synchronous sensing for the tape sensors.  If I get really worried about the digital signal in worst-case conditions (like too large a distance), I could increase the size of the sense resistor further.  With a 22kΩ sense resistor, I get a very clean separation between white and black even at 1cm.

I have to decide whether to pulse the IR emitters and wait at least 100µs before reading all the sensors, or just to leave them on all the time (at a cost of 10mA per tape sensor). If they are on all the time, I could use the 5V supply (with a 390Ω current-limiting resistor instead of a 220Ω one), and not worry about overloading the Teensy regulator. This could also simplify wiring, as the 5V regulator could be on the power board on the first level and the battery wiring would be limited to the first level.

The Teensy 3.1/3.2 digital pins are 5V-tolerant, so I could even connect the phototransistor collectors to 5V and put the multiplexer on the first level using 5V power. I could then put the sense resistors on the tape-sensor boards and have three wires for each board: 5V, GND, and WHITE.  I could use 3-pin male headers and standard Futaba servo cables to do the wiring.

I ordered a set of servo cables through Amazon, but they are not expected to arrive for another 2–6 weeks, so aren’t going to do me much good.)  I can make my own, but I’ve been having trouble lately with intermittent contacts from the crimp-on connectors and have taken to wicking tiny amounts of solder into the crimp, which adds a lot of time to making the cables.

With the multiplexer on the first layer, the only cabling from the tape sensors to higher levels would be 5V, Gnd, 3 select signals, and the (now digital) signal for sensing the tape. The motors are also on the bottom level, and they would additionally need 2 wires for controlling each motor and 2 wires per motor for feedback from the Hall-effect encoders. This makes the total wire bundle from the bottom level up to higher levels be only 14 wires (5V, Gnd, 4 for tape sensors, 2×4 for motors), with none of the wires having high-current switching.  The only high current wires are the 5V and Gnd wires, which may be feeding servo motors on higher levels—I may want a separate power wire from one of the switching regulators for powering servo motors on the higher levels, though.

The Teensy LC is not 5V-tolerant, so if I used that for the main controller board, I would need to communicate a 3.3V power line as well for the phototransistors and the motor encoders.  I think that I’ll simply declare that the main controller needs to be 5V-tolerant for digital inputs.

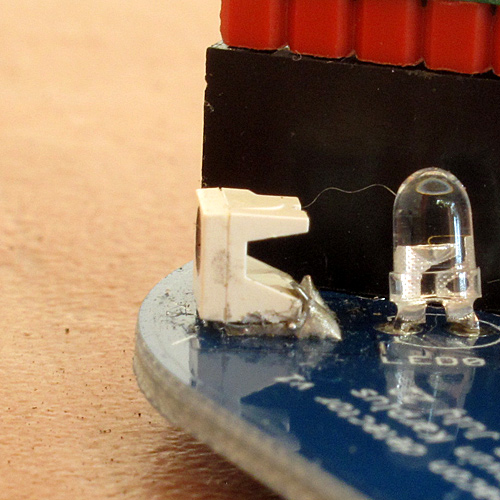
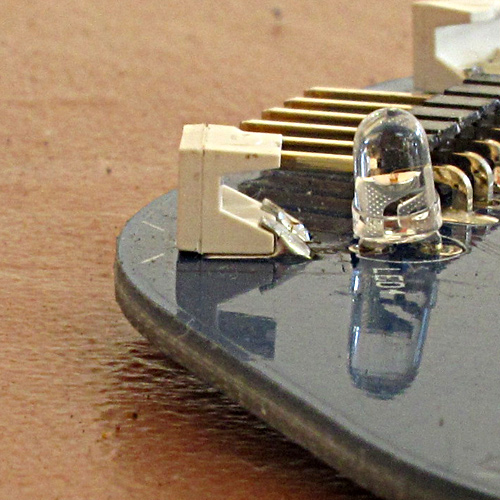
[Update 2017 Nov 18: I soldered up one of the TCRT5000L circuits, so that I could do a little more testing and make sure that I had a layout that worked.  It turned out that 22kΩ for the sense resistor was too large—at some distances the electrical tape reflected enough light to get above the 1.15V which is the guaranteed max VIL and maybe even enough to get to switch to high. I took out the 22kΩ and used a 10kΩ, and the problem with black reflecting too much light went away, but white still produced a very strong signal. I should be able to detect the white board reliably with just digital inputs out to about 1.4cm, much more than the 0.8cm clearance.

2017 August 6

Beacon detector board

I’m planning to sit in on CMPE 118/L (Mechatronics) this fall, and so I started looking over some of the material for the course from previous years.  One exercise involved designing a “beacon detector” that signals when it sees an infrared signal modulated with a 2kHz square wave. The exercise calls for an all-analog solution (phototransistor, transimpedance amplifier, active filter, rectifier, peak detector, …), which I plan to do when the time comes, but I got intrigued by the idea of doing an almost purely digital design.  That was the motivation for the Goertzel filter blog post.

I decided to take the digital design further and make a beacon detector that not only detects the 2kHz IR beacon, but also indicates what direction it is in.  To do this, I wanted 8 phototransistors around a circle, with one every 45°.  One can get a crude estimate of the angle from just which detector gets the strongest signal, but with wide-angle sensors one should be able to get finer estimates by looking at the ratio of the signals from two adjacent channels.

Because I was deliberately going for minimal analog design as an exercise, I used just a phototransistor and a pullup resistor for each channel, and a Teensy LC board for all the processing.  I chose SFH325FA side-look phototransistors, because they provide a nice, cubical package that I thought would make them easier to align.  They are surface-mount components, but with a 2.54mm pitch for the two terminals, they aren’t much harder to solder than through-hole parts.

For testing, I soldered one of the SFH325FA phototransistors to a pair of male header pins. This allowed me to experiment with different pullup resistor sizes in different lighting conditions and at different distances from an IR emitter.

My experimentation with different pullup resistors indicated that I could not operate in full sunlight, no matter what size pullup resistor I used—when the pullup was small enough that the phototransistor had sufficient voltage across it in full sunlight, the signal from the IR beacon was too small to be useful.  With AC-coupled amplifiers, I could have made it work, but I was committed to nearly pure digital solution.  If I had sunlight nearby, but the phototransistor itself was shaded, then I could go up to 22kΩ for the pullup without problems. The limiting factor was then that a very close beacon could saturate the detector, making it hard to determine power ratios.  I ended up choosing 22kΩ as my pullup, as I wanted to detect beacons from up to 2m away.

With a 22kΩ pullup and a strong signal, I can get a very clean “shark’s fin” waveform, because of the capacitance of the phototransistor acting with the resistor as a low-pass filter.  This low-pass filtering helps remove aliasing artifacts from the sampling by the analog-to-digital filter.

Behind each phototransistor I placed an LED, to indicate which channel had the maximum signal.  I charlieplexed the LEDs, so that I needed only 4 I/O pins for the 8 LEDs (I could encode up to 12 LEDs with 4 charlieplex wires). I used WP710A10SGC green LEDs for the indicators, because I had a lot of them around, but it would have been better to use an amber LED with a wide-angle, diffuse case, as the green indicators are only clearly visible over a fairly narrow angle.  The current-limiting resistors I used would keep the current low enough even with a low-forward-voltage red LED.

I also added an RGB LED to indicate the overall state—I used a common-anode one, because my son had a lot of them with diffuse cases, which are best for an indicator that needs to be seen from any angle.  The RGB LEDs were part of an unidentified lot from China, so I don’t have a part number or specs for them.  I hooked them up to PWM pins, so that I could adjust the brightness and color as needed.

I also designed in a connector for SPI connection, so that the board could be used a slave peripheral of another microcontroller.  I used Eagle on my old laptop to design the PCB (I know that in Need to find new PC board software and PCB CAD tools I said that I would be trying to switch to KiCAD or Diptrace, but I was lazy and stuck with what I already knew how to use).

I sent the design to Seeedstudio to make the PCB—like many of the Chinese firms that cater to hobbyists, they had a sale in July of boards up to 10cm×10cm for only $5.  Of course, it cost me another $21 for shipping with DHL, because I was too impatient to wait for Chinese air mail (and not trusting enough of the reliability). I chose Seeedstudio because they had the best user interface to their design-rule check, and at least as good pricing as anyone else.

The boards arrived quite quickly—only 8 days from order to delivery. Here is what they look like:

The back of the board has some documentation to remind me what is connected where.

The front of the board has relatively little documentation.

The boards are 8cm×8cm, fitting comfortably within both the cheap manufacturing limit and the Eagle free-version size limit.  I made them this big so that the Teensy LC board would fit without interfering with mounting holes (for M2 and M3 screws) and a central hole for attaching the board to a servo arm.

Getting a good right angle for the surface-mount phototransistors took some practice:

My first solder joint for the SFH325FA phototransistor tilted the transistor substantially, because the solder underneath formed a wedge. I reworked it a couple of times and finally got something sort of acceptable.

By the fifth phototransistor, I had worked out a technique that seemed to hold the phototransistor cleanly at a right angle. There is probably not much solder underneath the phototransistor, but the large wedge behind the phototransistor should provide sufficient mechanical strength.

Here are pictures of the populated board:

The back of the board does not look very different after being populated. I put one M3 screw in the bottom M3 screw hole, in order to see how compatible the screw hole design is with the screw head.

The top of the board, when populated shows how close channels 0 and 7 come to the Teensy board.

Here the board is on (powered through the USB cable), detecting an IR beacon about a meter away in the direction of channel 4. The green LED by the channel indicates the direction, and the green RGB LED indicates a strong signal.

I put the header pins on the pullup resistors, so that I could record the signal seen by the analog-to-digital converters.  Unfortunately, the signal is much noisier than I expected:

The large spikes are at 15kHz, and probably correspond to noise injected by the ADC sampling.

I turned off the beacon and looked just at the noise spikes, using the 10× probe on the oscilloscope to get better bandwidth.  I sampled at 100MHz and averaged 1000 traces to get a clean view of the signal (the triggering was set far enough from the background level that only fairly large spikes were captured, but close enough that the 1000 frames were gathered as quickly as possible).

The pulses are very short (2–3 µs), so almost certainly correspond to the charging of the sampling capacitor. After looking at this waveform, I changed my sample time on the ADC to 2µs (it had been 1µs) to reduce the noise in what the ADC reports.

This post has gotten more than long enough, though I still have a couple of things that should be added: a schematic diagram of the board and a plot of the reported angle vs actual angle.

The schematics from Eagle are really ugly, so I’ve been thinking about redrawing them with SchemeIt—perhaps that can be a subsequent post.

The reported angle vs. actual angle plot is going to require building a jig that allow me to set the angle precisely.  I tried jury-rigging something out of Lego today, but the result had too much slop—the board could not be reliably set level with the IR emitter at a fixed angle.  The OED-EL-1L2 5mm IR emitter does fit in the middle hole of a Lego Technic brick, so I using Lego to align the IR emitter was attractive. I may have to make something out of wood and MDF (medium-density fiberboard) for a more solid test jig.  The M3 screw holes will allow me to attach the board firmly to MDF with standoffs, and I can drill holes in Lego bricks to make a stand for the IR emitter.


2014 June 10

Digi-key end-of-life notification for IR emitter

Filed under: Circuits course — gasstationwithoutpumps @ 11:12
Tags: , , ,

One of the things I like about dealing with Digi-key as a supplier for electronics parts is that they treat me like an important customer, even though I order only small numbers of parts.  For example, they automatically send out notifications whenever a manufacturer informs them that a part is being discontinued—like the notice I got today:

Part Life Notification

Dear Valued Digi-Key Customer,

You have purchased the following part number from Digi-Key within the last two years. The manufacturer has announced an update to the part status.

Part Affected
Manufacturer OSRAM OPTO SEMICONDUCTORS INC
Description LED IR EMITTER 950NM
Manufacturer Part Number SFH 4512
Digi-Key Part Number 475-2943-ND
Customer Reference Number IR EMITTER
Status End Of Life
Last Time Buy Date 12/01/2014
Substitutes Please click here

It used to be that only big industrial customers got that sort of service—now even hobbyists, students, and professors can be kept informed about the parts they use. Digi-key doesn’t have to spend a lot to do individual notifications (it’s all automated), but it probably took them a fair amount of time to set up the system to do so, and this sort of attention to customer service is one of the things that has made me a loyal (though small) customer.

I’ll drop the IR emitter from next year’s class part list (we didn’t do much with it this year anyway).

I’ll also change the red LED from LED red diffuse 3mm 625nm WP710A10ID to WP3A8HD whose peak emission is at 700nm (where the molar extinction coefficient for oxyhemoglobin is only 290 cm-1/M, rather than ~683 cm-1/M for the 627nm peak of the WP710A10ID we used this year). Ideal would be a 686nm peak, where oxyhemoglobin is most transparent (272.8 cm-1/M), but there’s not much available between 700nm and 660nm (some more expensive ones at 697nm, which makes little difference from 700nm), and 700nm is better than 660nm.

2013 July 27

Failed attempt at pulse oximeter

In Optical pulse monitor with little electronics  and Digital filters for pulse monitor, I developed an optical pulse monitor using an IR emitter, a phototransistor, 2 resistors, and an Arduino.  On Thursday, I decided to try to extend this to a pulse oximeter, by adding a red LED (and current-limiting resistor) as well.  Because excluding ambient light is so important, I decided to build a mount for everything out of a block of wood:

Short piece of 2x2 wood, with a 3/4" diameter hoe drilled with a Forstner bit part way through the block.  Two 1/8" holes drilled for 3mm LEDs on top, and one for a 3mm phototransistor on the bottom (lined up with the red LED).  Wiring channels were cut with the same 1/8" drill bit, and opened up a with a round riffler.  Electrical tape holds the LEDs and phototransistor in place (removed here to expose the diodes).

Short piece of 2×2 wood, with a 3/4″ diameter hole drilled with a Forstner bit partway through the block. Two 1/8″ holes drilled for 3mm LEDs on top, and one for a 3mm phototransistor on the bottom (lined up with the red LED). Wiring channels were cut with the same 1/8″ drill bit, and opened up a with a round riffler. Electrical tape holds the LEDs and phototransistor in place (removed here to expose the diodes).

My first test with the new setup was disappointing.  The signal from the IR LED swamped out the signal from the red LED, being at least 4 times as large. The RC discharge curves for the phototransistor for the IR signal was slow enough that I would have had to go to a very low sampling rate to see the red LED signal without interference from the discharge from the IR pulse.  I could reduce the signal for the IR LED to only twice the red output by increasing the IR current-limiting resistor to 1.5kΩ, and reduce the RC time constant of the phototransistor by reducing the pulldown resistor for it to 100kΩ The reduction in the output of the IR LED and decreased sensitivity of the phototransistor made about a 17-fold reduction in the amplitude of the IR signal, and the red signal was about a thirtieth of what I’d previously been getting for the IR signal.  Since the variation in amplitude that made up my real signal was about 10 counts before, it is substantially less than 1 count now, and is  too small to be detected even with the digital filters that I used.

I could probably solve this problem of a small signal by switching from the Arduino to the KL25Z, since going from a 10-bit ADC to a 16-bit ADC would allow a 64 times larger signal-to-noise ratio (that is, +36dB), getting me back to enough signal to be detectable even with the reductions..  I’ve ordered headers from Digi-Key for the KL25Z, so next week I’ll be able to test this.

I did do something very stupid yesterday, though in a misguided attempt to fix the problem.  I had another red LED (WP710A10ID) that was listed on the spec sheet as being much brighter than the one I’d been using (WP3A8HD), so I soldered it in.  The LED was clearly much brighter, but when I put my finger in the sensor, I got almost no red signal!  What went wrong?

A moment’s thought explained the problem to me (I just wish I had done that thinking BEFORE soldering in the LED).  Why was the new LED brighter for the same current?  It wasn’t that the LED was more efficient at generating photons, but that the wavelength of the light was shorter, and so the eye was more sensitive to it.

Spectrum of the WP3A8HD red LED that I first used.  It has a peak at 700nm and dominant wavelength at 660nm.  I believe that the "dominant wavelength" refers to the peak of the spectrum multiplied by the sensitivity of the human eye.

Spectrum of the WP3A8HD red LED that I first used. It has a peak at 700nm and dominant wavelength at 660nm. I believe that the “dominant wavelength” refers to the peak of the spectrum multiplied by the sensitivity of the human eye.  Spectrum copied from Kingbright preliminary specification for WP3A8HD.

Spectrum of the WP710A10ID brighter red LED.  The peak is at 627nm and the "dominant wavelength" is 617nm.  The extra brightness is coming from this shorter wavelength, where the human eye is more sensitive.

Spectrum of the WP710A10ID brighter red LED that didn’t work for me. The peak is at 627nm and the “dominant wavelength” is 617nm. The extra brightness is coming from this shorter wavelength, where the human eye is more sensitive. Image copied from the Kingbright spec sheet.

CIE_1931 luminosity curve, representing a stndardized sensitivity of the human eye under high-light conditions (scotopic vision).  Copied from Wikipedia: http://upload.wikimedia.org/wikipedia/commons/thumb/7/72/CIE_1931_Luminosity.png/640px-CIE_1931_Luminosity.png

1931 CIE luminosity curve, representing a standardized sensitivity of the human eye with bright lighting (photopic vision). The peak is at 555nm. Note that there are better estimates of human eye sensitivity now available (see the discussion of newer ones in the Wikipedia article on the Luminosity function).
Image copied from Wikipedia.

The new LED is brighter, because the human eye is more sensitive to its shorter wavelength, but the optimum sensitivity of the phototransistor is at longer wavelengths, so the phototransistor is less sensitive to the new LED than to the old one.

Typical spectral sensitivity of a silicon photodiode or phototransistor.  This curve does not take into account any absorption losses in the packaging of the part, which can substantially change the response.  Unfortunately, Kingbright does not publish a spectral sensitivity curve for their WP3DP3B phototransistor.  Image copied from https://upload.wikimedia.org/wikipedia/commons/4/41/Response_silicon_photodiode.svg

Typical spectral sensitivity of a silicon photodiode or phototransistor. This curve does not take into account any absorption losses in the packaging of the part, which can substantially change the response. Note that the peak sensitivity is in the infrared, around 950nm, not in the green around 555nm as with the human eye. Unfortunately, Kingbright does not publish a spectral sensitivity curve for their WP3DP3B phototransistor, so this image is a generic one copied from https://upload.wikimedia.org/wikipedia/commons/4/41/Response_silicon_photodiode.svg

This sensitivity is much better matched to the IR emitter (WP710A10F3C) than to either of the red LEDs:

Spectrum for the WP710A10F3C IR emitter, copied from the Kingbright spec sheet.  The peak is at 940nm with a 50nm bandwidth.  There is no "dominant wavelength", because essentially all the emissions are outside the range of the human eye.

Spectrum for the WP710A10F3C IR emitter, copied from the Kingbright spec sheet. The peak is at 940nm with a 50nm bandwidth. There is no “dominant wavelength”, because essentially all the emissions are outside the range of the human eye.

Furthermore, blood and flesh is more opaque at the shorter wavelength, so I had more light absorbed and less sensitivity in the detector, making for a much smaller signal.

Scott Prahl's estimate of oxyhemoglobin and deoxyhemoglobin molar extinction coefficients, copied from http://omlc.ogi.edu/spectra/hemoglobin/summary.gif The higher the curve here the less light is transmitted.  Note that 700nm has very low absorption, but 627nm has much higher absorption.

Scott Prahl’s estimate of oxyhemoglobin and deoxyhemoglobin molar extinction coefficients, copied from http://omlc.ogi.edu/spectra/hemoglobin/summary.gif
Tabulated values are available at http://omlc.ogi.edu/spectra/hemoglobin/summary.html and general discussion at http://omlc.ogi.edu/spectra/hemoglobin/
The higher the curve here the less light is transmitted. Note that 700nm has very low absorption (290), but 627nm has over twice as high an absorption (683).  Also notice that in the infrared

I had to go back to the red LED (WP3A8HD) that I started with. Here is an example of the waveform I get with that LED, dropping the sampling rate to 10Hz:

The green waveform is the voltage driving the red LED and through a 100Ω resistor.  The red LED is on for the 1/30th of second that the output is low, then the IR LED is on (through a 1.5kΩ resistor) for 1/30th of a second, then both are off.  THe yellow trace shows the voltage at the phototransistor emitter with a 680kΩ pulldown. This signal seems to have too little amplitude for the variation to be detected with the Arduino.

The green waveform is the voltage driving the red LED and through a 100Ω resistor. The red LED is on for the 1/30th of second that the output is low, then the IR LED is on (through a 1.5kΩ resistor) for 1/30th of a second, then both are off. THe yellow trace shows the voltage at the phototransistor emitter with a 680kΩ pulldown.
This signal seems to have too little amplitude for the variation to be detected with the Arduino (the scale is 1v/division with 0v at the bottom of the grid).

I can try increasing the signal by using 2 or more red LEDs (though the amount of current needed gets large), or I could turn down the IR signal to match the red signal and use an amplifier to get a big enough signal for the Arduino to read.  Sometimes it seems like a 4.7kΩ resistor on the IR emitter matches the output, and sometimes there is still much more IR signal received, depending on which finger I use and how I hold it in the device.

I was thinking of playing with some amplification, but I could only get a gain of about 8, and even then I’d be risking saturation of the amplifier.  I think I’ll wait until the headers come and I can try the KL25Z board—the gain of 64 from the higher resolution ADC is likely to be more useful.  If that isn’t enough, I can try adding gain also.  I could also eliminate the “off-state” and just amplify the difference between IR illumination and red illumination.  I wonder if that will let me detect the pulse, though.

2013 July 24

Digital filters for pulse monitor

In Optical pulse monitor with little electronics, I talked a bit about an optical pulse monitor using the Arduino and just 4 components (2 resistors, an IR emitter, and a phototransistor).  Yesterday, I had gotten as far as getting good values for resistors, doing synchronous decoding, and using a very simple low-pass IIR filter to clean up the noise.  The final result still had problems with the baseline shifting (probably due to slight movements of my finger in the sensor):

With digital low-pass filtering, the pulse signal is much cleaner, but the sharp downward transition at the start of each pulse has been rounded off by the filter.

(click to embiggen) Yesterday’s plot with digital low-pass filtering, using y(t) = (x(t) + 7 y(t-1) )/8.  There is not much noise, but the baseline wobbles up and down a lot, making the signal hard to process automatically.

Today I decided to brush off my digital filter knowledge, which I haven’t used much lately, and see if I could design a filter using only small integer arithmetic on the Arduino, to clean up the signal more. I decided to use a sampling rate fs = 30Hz on the Arduino, to avoid getting any beating due to 60Hz pickup (not that I’ve seen much with my current setup). The 30Hz choice was made because I do two measurements (IR on and IR off) for each sample, so my actual measurements are at 60Hz, and should be in the same place in any noise waveform that is picked up. (Europeans with 50Hz line frequency would want to use 25Hz as their sampling frequency.)

With the 680kΩ resistor that I selected yesterday, the 30Hz sampling leaves plenty of time for the signal to charge and discharge:

The grid line in the center is at 3v.  The green trace is the signal to on the positive side of the IR LED, so the LED is on when the trace is low (with 32mA current through the pullup resistor).  The yellow trace is the voltage at the Arduino input pin: high when light is visible, low when it is dark.  This recording was made with my middle finger between the LED and the phototransistor.

The grid line in the center is at 3v. The green trace is the signal to on the positive side of the IR LED, so the LED is on when the trace is low (with 32mA current through the pullup resistor). The yellow trace is the voltage at the Arduino input pin: high when light is visible, low when it is dark. This recording was made with my middle finger between the LED and the phototransistor.

I decided I wanted to replace the low-pass filter with a passband filter, centered near 1Hz (60 beats per minute), but with a range of about 0.4Hz (24 bpm) to 4Hz (240bpm). I don’t need the passband to be particularly flat, so I decided to go with a simple 2-pole, 2-zero filter (called a biquad filter). This filter has the transfer function

H(z) = \frac{b_{0} + b_{1}z^{-1} + b_{2}z^{-2}}{1+a_{1}z^{-1}+a_{2}z^{-2}}

To get the gain of the filter at a frequency f, you just compute \left| H( e^{i \omega} ) \right|, where \omega = 2 \pi f / f_{s}.  Note that the z values that correspond to sinusoids are along the unit circle, from DC at e^{0} = 1 up to the Nyquist frequency f_{s}/2 at e^{\pi} = -1.

The filter is implemented as a simple recurrence relation between the input x and the output y:

y(t) = b_{0} x(t) + b_{1}x(t-1) + b_{2}x(t-2) - a_{1}y(t-1) - a_{2}y(t-2)

This is known as the “direct” implementation.  It takes a bit more memory than the “canonical” implementation, but has some nice properties when used with small-word arithmetic—the intermediate values never get any further from 0 than the output and input values, so there is no overflow to worry about in intermediate computations.

I tried using an online web tool to design the filter http://www-users.cs.york.ac.uk/~fisher/mkfilter/, and I got some results but not everything on the page is working.  One can’t very well complain to Tony Fisher about the maintenance, since he died in 2000. I tried using the tool at http://digitalfilter.com/enindex.html to look at filter gain, but it has an awkward x-axis (linear instead of logarithmic frequency) and was a bit annoying to use.  So I looked at results from Tony Fisher’s program, then used my own gnuplot script to look at the response for filter parameters I was interested in.

The filter program gave me one obvious result (that I should not have needed a program to realize): the two zeros need to be at DC and the Nyquist frequency—that is at ±1.  That means that the numerator of the transfer function is just 1-z^{-2}
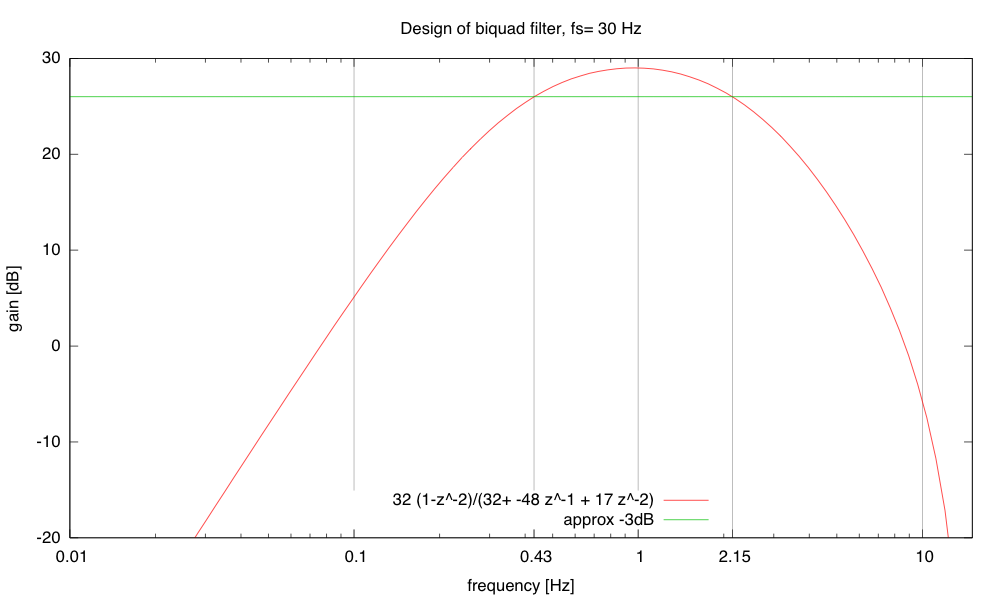
, and b0=1, b1=0, and b2=–1.  The other two parameters it gave me were a2=0.4327386423 and a1=–1.3802466192.  Of course, I don’t want to use floating-point arithmetic, but small integer arithmetic, so that the only division I do is by powers of 2 (which the compiler turns into a quick shift operation).

I somewhat arbitrarily selected 32 as my power of 2 to divide by, so that my transfer function is now

H(z) = 32 \frac{1 - z^{-2}}{32+A_{1}z^{-1}+A_{2}z^{-2}}

and my recurrence relation is

y(t) = \left(32 \left( x(t) - x(t-2) \right) - A_{1} y(t-1) - A_{2} y(t-2) \right)/32

with A1 and A2 restricted to be integers.  Rounding the numbers from Fisher’s program suggested A1=-44 and A2=14, but that centered the filter at a bit higher frequency than I liked, so I tweaked the parameters and drew plots to see what the gain function looked like.  I made one serious mistake initially—I neglected to check that the two poles were both inside the unit circle (they were real-valued poles, so the check was just applying the quadratic formula).  My first design (not the one from Fisher’s program) had one pole outside the unit circle—it looked fine on the plot, but when I implemented it, the values grew until the word size was exceeded, then oscillated all over the place.  When I realized what was wrong, I checked the stability criterion and changed the A2 value to make the pole be inside the unit circle.

I eventually ended up with A1=-48 and A2=17, which centered the filter at 1, but did not have as high an upper frequency as I had originally thought I wanted:

The gain of the filter that I ended up implementing has -3dB points at about 0.43 and 2.15 Hz.

(click to embiggen) The gain of the filter that I ended up implementing has -3dB points at about 0.43 and 2.15 Hz.

Here is the gnuplot script I used to generate the plot—it is not fully automatic (the xtics, for example, are manually set). Click it to expand.

fs = 30	# sampling frequency
A0=32.  # multiplier (use power of 2)
b=16.

A1=-(A0+b)
A2=b+1

peak = fs/A0	# approx frequency of peak of filter

set title sprintf("Design of biquad filter, fs=%3g Hz",fs)

set key bottom center
set ylabel "gain [dB]"
unset logscale y
set yrange [-20:30]

set xlabel "frequency [Hz]"
set logscale x
set xrange [0.01:0.5*fs]

set xtics add (0.43, 2.15)
set grid xtics

j=sqrt(-1)
biquad(zinv,b0,b1,b2,a0,a1,a2) = (b0+zinv*(b1+zinv*b2))/(a0+zinv*(a1+zinv*a2))
gain(f,b0,b1,b2,a0,a1,a2) = abs( biquad(exp(j*2*pi*f/fs),b0,b1,b2,a0,a1,a2))
phase(f,b0,b1,b2,a0,a1,a2) = imag(log( biquad(exp(j*2*pi*f/fs),b0,b1,b2,a0,a1,a2)))

plot 20*log(gain(x,A0,0,-A0,  A0,A1,A2)) \
		title sprintf("%.0f (1-z^-2)/(%.0f+ %.0f z^-1 + %.0f z^-2)", \
			A0, A0, A1, A2), \
	20*log(gain(peak,A0,0,-A0,  A0,A1,A2))-3 title "approx -3dB"

I wrote a simple Arduino program to sample the phototransistor every 1/60th of a second, alternating between IR off and IR on. After each IR-on reading, I output the time, the difference between on and off readings, and the filtered difference. (click on the code box to view it)

#include "TimerOne.h"

#define rLED 3
#define irLED 5

// #define CANONICAL   // use canonical, rather than direct implementation of IIR filter
// Direct implementation seems to avoid overflow better.
// There is probably still a bug in the canonical implementation, as it is quite unstable.

#define fs (30) // sampling frequency in Hz
#define half_period (500000L/fs)  // half the period in usec

#define multiplier  32      // power of 2 near fs
#define a1  (-48)           // -(multiplier+k)
#define a2  (17)            // k+1

volatile uint8_t first_tick;    // Is this the first tick after setup?
void setup(void)
{
    Serial.begin(115200);
//    pinMode(rLED,OUTPUT);
    pinMode(irLED,OUTPUT);
//    digitalWrite(rLED,1);  // Turn RED LED off
    digitalWrite(irLED,1); // Turn IR LED off

    Serial.print("# bandpass IIR filter\n# fs=");
    Serial.print(fs);
    Serial.print(" Hz, period=");
    Serial.print(2*half_period);
    Serial.print(" usec\n#  H(z) = ");
    Serial.print(multiplier);
    Serial.print("(1-z^-2)/(");
    Serial.print(multiplier);
    Serial.print(" + ");
    Serial.print(a1);
    Serial.print("z^-1 + ");
    Serial.print(a2);
    Serial.println("z^-2)");
#ifdef CANONICAL
    Serial.println("# using canonical implementation");
#else
    Serial.println("# using direct implementation");
#endif
    Serial.println("#  microsec raw   filtered");

    first_tick=1;
    Timer1.initialize(half_period);
    Timer1.attachInterrupt(half_period_tick,half_period);
}

#ifdef CANONICAL
// for canonical implementation
 volatile int32_t w_0, w_1, w_2;
#else
// For direct implementation
 volatile int32_t x_1,x_2, y_0,y_1,y_2;
#endif

void loop()
{
}

volatile uint8_t IR_is_on=0;    // current state of IR LED
volatile uint16_t IR_off;       // reading when IR is off (stored until next tick)

void half_period_tick(void)
{
    uint32_t timestamp=micros();

    uint16_t IR_read;
    IR_read = analogRead(0);
    if (!IR_is_on)
    {   IR_off=IR_read;
        digitalWrite(irLED,0); // Turn IR LED on
        IR_is_on = 1;
        return;
    }

    digitalWrite(irLED,1); // Turn IR LED off
    IR_is_on = 0;

    Serial.print(timestamp);
    Serial.print(" ");

    int16_t x_0 = IR_read-IR_off;
    Serial.print(x_0);
    Serial.print(" ");

 #ifdef CANONICAL
    if (first_tick)
    {  // I'm not sure how to initialize w for the first tick
       w_2 = w_1 = multiplier*x_0/ (1+a1+a2);
       first_tick = 0;
    }
 #else
    if (first_tick)
    {   x_2 = x_1 = x_0;
        first_tick = 0;
    }
#endif

#ifdef CANONICAL
    w_0 = multiplier*x_0 - a1*w_1 -a2*w_2;
    int32_t y_0 = w_0 - w_2;
    Serial.println(y_0);
    w_2=w_1;
    w_1=w_0;
#else
     y_0 = multiplier*(x_0-x_2) - a1*y_1 -a2*y_2;
     Serial.println(y_0);
     y_0 /= multiplier;
     x_2 = x_1;
     x_1 = x_0;
     y_2 = y_1;
     y_1 = y_0;
#endif
}

Here are a couple of examples of the input and output of the filtering:

    The input signals here are fairly clean, but different runs often get quite different amounts of light through the finger, depending on which finger is used and the alignment with the phototransistor. Note that the DC offset shifts over the course of each run.

(click to embiggen) The input signals here are fairly clean, but different runs often get quite different amounts of light through the finger, depending on which finger is used and the alignment with the phototransistor. Note that the DC offset shifts over the course of each run.

IR-biquad-filtered

(click to embiggen) After filtering the DC offset and the baseline shift are gone. The two very different input sequences now have almost the same range. There is a large, clean downward spike at the beginning of each pulse.

Overall, I’m pretty happy with the results of doing digital filtering here. Even a crude 2-zero, 2-pole filter using just integer arithmetic does an excellent job of cleaning up the signal.

Next Page »