Gas station without pumps

2017 April 10

Electret microphone hysteresis

Filed under: Circuits course,Data acquisition — gasstationwithoutpumps @ 09:05
Tags: , , , ,

In attempting to determine the I-vs-V characteristics of an electret microphone, I stumbled across a phenomenon that I’m still having difficulty explaining.  What I was looking for was a plot like this one:

I-vs-V DC characteristics for an electret microphone. The linear and saturation regions are nicely distinguished and there is little noise.

In previous years I had collected the data with PteroDAQ, but this plot was done with my Analog Discovery 2, which combines both the function generator and the data acquisition. Because I was in a bit of a hurry, the first time I tried doing the characterization, I used a shorter period for the function generator, and got a somewhat different plot:

The hysteresis observed here was unexpected. The loop is traced clockwise, with the upper curve for increasing voltage and the lower curve for decreasing voltage.

At first I thought that the effect was a thermal one, like I saw when characterizing power MOSFETs, but a thermal phenomenon would get more pronounced at slower sweep rates (more time to heat up and cool down), while the hysteresis here could be reduced by sweeping very slowly. Also, the hysteresis did not rely on running large currents—the mic was dissipating less than 1mW at the most, and changing the voltage range did not change the hysteresis much.

My next conjecture was a capacitive effect, which I tentatively confirmed by either adding a capacitor in parallel with mic (increasing the hysteresis) or a capacitor in parallel with the 5.1kΩ sense resistor (which reduced the hysteresis or even reversed it).

I tried playing with the frequency of the excitation waveform, to see what happened to the hysteresis:

This pretty plot shows the transition from nearly DC (the curve that looks like the first one of the post) to something that looks almost like a resistor, with current going up linearly with voltage, as the frequency is increased.

Because the hysteresis did not seem to depend on the amount of the sweep, I picked a voltage well into the saturation region (4V), and tried doing a Bode plot of impedance for the mic for a relatively small signal (±1V). I then fit the Bode plot with an (R1+C)||R2 model:

The parallel resistor corresponds to the slope of the DC I-vs-V curve around a bias of 4V. The model fits the data so well that the curve for the data is hidden by the model curve.

I also tried a Bode plot for a DC offset of 2V and an amplitude of ±300mV:

Like with the 4V DC bias, I got an extremely good fit with the (R1+C)||R2 model. The parallel resistance is different, because the slope of the I-vs-V plot is a little higher (so smaller resistance) at 2V than at 4V.

Because the network tool in WaveForms 2015 provides phase information as well as magnitude information, I did my fit first on magnitude, then on phase. The phase fitting was also extremely good:

I show only the 2V phase plot here—the 4V one is similar, though the biggest phase shift is -56.5° at 3.5V, rather than -45.1° at 4.6 Hz.

So I have an excellent electrical model of the behavior of the electret mic at a couple of different bias voltages, with a simple explanation for one of the parameters of the model. I’m still mystified where the capacitance (about 1.7µF) and the other resistance (about 8kΩ) come from. I suppose, theoretically, that they could be tiny surface mount components inside the can of the mic, but I see no reason for the manufacturer to go to the trouble and expense of doing that. The pictures of a disassembled mic at http://www.openmusiclabs.com/learning/sensors/electret-microphones/ suggest a rather low-tech, price-sensitive manufacturing process.

Incidentally, until I looked at those pictures, I had a rather different mental model of how the electret mic was assembled, envisioning one with a simple membrane and the electret on the gate of a MOSFET. It seems that the electret is put on the surface of the membrane and a jFET is used rather than a MOSFET. After thinking about it for a while, I believe that a jFET is used in order to take advantage of the slight leakage current to the gate—the gate will be properly biased as a result of the leakage. The OpenMusicLabs post showed a 2SK596 jFET (an obsolete part), which has an input resistance of only 25—35MΩ, easily low enough to provide bias due to leakage currents. If the gate is biased to be about 0V relative to the source, then the jFET is on by default,

The 1.7µF capacitance is huge—many orders of magnitude larger than I could explain by a Miller effect (unless I’ve screwed up my computations totally) as all the capacitances for the jFET are in the pF range, and the multiplier for the Miller effect should only be around 5–50 (1–10mS times the 5.1kΩ load), so I’m still at a loss to explain the hysteresis. I checked to see whether the effect was something in my test setup, by replacing the mic with a 10kΩ resistor, but it behaved like a 10kΩ resistor across the full range of frequencies that I used for testing the mic—this is not some weird artifact of the test setup, but a phenomenon of the microphone (and probably just of the jFET in the mic).

I suppose I should buy a jFET (maybe a J113, that has a 2mA saturation current with a 0V Vgs) to see if other jFETS have similar properties, connecting the gate to the source with a small capacitor to imitate the electret biasing.

Incidentally, while doing this experimenting, I found a bug in the Waveforms 2015 code: if you sweep the frequencies downward in the network analyzer (which works), on output to a file the frequencies are misreported (as if they had been swept upward). I reported this on the Digilent Forum, and they claim it will be fixed in the next release. The time between the report and the acknowledgement was only a few hours, which is one of the fastest responses I’ve seen for a software bug report. (They didn’t say when the next release will be, but they’ve had several since I bought my Analog Discovery 2 four months ago, so they seem to be releasing bug fix versions rapidly.)

2016 December 15

Electret mic DC characterization with Analog Discovery 2

I tried one of the standard labs for the course, producing an I-vs-V plot for an electret microphone, using the Analog Discovery 2 function generator and oscilloscope, rather than a bench function generator and a Teensy board with PteroDAQ.

It was fairly easy to set up a 0–5V triangle wave, running at a very low frequency (50mHz, for a 20-second period).  The maximum output from the waveform generator is 5V, so setting the amplitude higher did not get larger voltages.  The signal was applied across the microphone in series with a sense resistor, and the voltage measured across the mic and across the sense resistor.

I ended up using two different sense resistors: one for measuring the current at high voltages, and one for measuring the current at low voltages, and I had to adjust the voltage scales on the two channels of the scope for the different ranges.  The results were fairly clean:

The low-voltage behavior of the nFET in the electret mic is not quite a linear resistor, and the saturation current definitely increases with voltage.

The low-voltage behavior of the nFET in the electret mic is not quite a linear resistor, and the saturation current definitely increases with voltage.

I tried extending the voltage range by using the power supply as well as the function generator: I set the function generator to a ±5V triangle wave, and used a -5V supply for the low-voltage reference. This worked well for the higher voltages, but the differential signal for the mic had an offset of about 12mV when the common-mode was -5V, which made the low-voltage measurements very wrong.  This offset may be correctable by recalibrating the scope (I am currently using the factory default settings, because I don’t have a voltmeter at home that I trust to be better than the factory settings), but I’m not counting on it.  When I need measurements of small signals, I’ll try to make sure that the common-mode is also small.

One other minor problem with the Analog Discovery 2: the female headers on the wires seem to have looser than usual springs, so that the wires easily fall off male header pins.  Given the stiffness of the wires, this is a bit

2014 March 31

New modeling lab for electret microphone

Last year, in Mic modeling lab rethought, I designed the DC measurement of an electret microphone around the capabilities of the Arduino analog-to-digital converters:

Circuit for measuring DC characteristics of an electret microphone.  The four labeled nodes are connected to the Arduino.

Circuit for measuring DC characteristics of an electret microphone. The four labeled nodes are connected to the Arduino.

  • The highest voltage allowed is 5v and the lowest is 0v.
  • The resolution is only 10 bits (1024 steps).
  • The steps seem to be more uniformly spaced at the low end of the range than the high end (so differences at the high end are less accurate than differences at the low end).
  • The external reference voltage AREF must be at least 0.5v (this is not in the data sheet, but when I tried lower AREF voltages, the reading was always 1023).

Test fixture for measuring I-vs-V DC characteristics of electret microphone.

Test fixture for measuring I-vs-V DC characteristics of electret microphone.


This year we’ll be using the KL25Z boards, which have different constraints:

  • The highest voltage is 3.3v and the lowest is 0v.
  • The resolution is 16 bits (15 bits in differential mode).
  • Differential mode only works if you stay away from the power rails—clipping occurs if you get too close.
  • The external reference must be at least 1.13v.  With less than a 3-fold range for the external reference, varying the external reference to get different ranges seems rather limited.

I think I’ll still have the students start with using the multimeter and the bench power supply to measure voltage and current pairs for 1V to 10v in steps of 1v.  But then I’ll have them wire up a different test fixture. The resistor R2 is one that students will have to choose to get an appropriate measuring range. Resistors R3 and R4 keep the voltages for the differential measurements E20–E21 and E22–E23 away from the power rails. I tried using smaller values, but 200Ω was not enough—I still got clipping problems. So 63mV is too close to the rails, but 275mV seems fine.  I suspect that the limit is around 100mV to 150mV, but I did not try to narrow it down.

I found that the differential measurements had less noise than single-ended measurements, despite having a resolution of about 100µV rather than the 50µV of single-ended measurements. Doing 32× hardware averaging also helped keep the noise down. (Note: the data sheet for the KL25 chip does claim a higher effective number of bits for differential measurement than for single-ended measurement, perhaps because of reduction in common-mode noise.)

I was able to get fairly clean measurements with just two different resistor sizes, to which I fit 4 different models:

  • linear resistance: I = V /R
  • constant current I = I_{sat}
  • blended: I = V/ \sqrt{ R^2 + (V/I_{sat})^2)}
  • blended with exponent: I = V/ \sqrt{ R^2 + (V^p/I_{sat})^2)}


    The blended fit with the extra exponent on voltage does a pretty good job of fitting over the full range (it looks good on a log-log scale also)

The blended fit with the extra exponent on voltage does a pretty good job of fitting over the full range (it looks good on a log-log scale also)

Because of the large characters used for the data points, the lines look fat, but the noise level is fairly small—about ±300µV Some of that may be due to the movement of the potentiometer, as the voltage and current aren’t measured at precisely the same time, but I suspect most is electrical noise in the processor itself.

2013 July 31

Microphone sensitivity exercise

Filed under: Circuits course — gasstationwithoutpumps @ 13:46
Tags: , , , ,

I’ve been thinking a bit about improving the microphone lab for the Applied Circuits course.  Last year, I had the students measure DC current vs. voltage for an electret microphone and then look at the microphone outputs on the oscilloscope (see Mic modeling lab rethought).  I still want to do those parts, but I’d like to add some more reading of the datasheet, so that students have a better understanding of how they will compute gain later in the quarter.

The idea for the change in this lab occurred to me after discussing the loudness detector that my son wanted for his summer engineering project.  He needed to determine what gain to use to connect a silicon MEMS microphone (SPQ2410HR5H-PD) to an analog input pin of a KL25 chip.  He wanted to use the full 16-bit range of the A-to-D, without much clipping at the highest sound levels. Each bit provides an extra 6.021dB of range, so the 16-bit ADC should have a 96.3dB dynamic range.  The sound levels he is interested in are about 24dB to 120dB, so the gain needs to be set so that a 120dB sound pressure level corresponds to a full-scale signal.

He is running a 3.3v board, so his full-scale is 3.3v peak-to-peak, or 1.17v RMS (for a sine wave).  That conversion relies on understanding the difference between RMS voltage and amplitude of a sine wave, and between amplitude and peak-to-peak voltage. The full-scale voltage is 20 log10(1.17), or about 1.3dB(V).

Microphone sensitivity is usually specified in dB (V/Pa), which is 20 log10 (RMS voltage) with a 1 pascal RMS pressure wave (usually at 1kHz).  The microphone he plans to use is specified at –42±3dB (V/Pa), which is fairly typical of both silicon MEMS and electret microphones.The conversion between sound pressure levels and pascals is fairly simple: at 1kHz a 1Pa RMS pressure wave is a sound pressure level of about 94dB.

Scaling amplitude is equivalent to adding in the logarithmic scale of decibels, so for a sound pressure level of 120dB, the microphone output would be about 120–94–42±3=–16±3dB(V), but we want 1.3dB, so we need a gain of about 17.3dB, which would be about 7.4×. Using 10× (20dB gain) would limit his top sound pressure level to 117dB, and using 5× would allow him to go to 123dB.

One can do similar analysis to figure out how big a signal to expect at ordinary conversational sound pressure levels (around 60dB):  60–94–42=–76db(V).  That corresponds to about a 160µV RMS or 450µV peak-to-peak signal.

I tried checking this with my electret mic, which is spec’ed at –44±2dB, so I should expect 60–94–44±2=–78±2dB, or 125µV RMS and 350µV peak-to-peak. Note that the spec sheet measures the sensitivity with a 2.2kΩ load and 3v power supply, but we can increase the sensitivity by increasing the load resistance.  I’m seeing about a 1mV signal on my scope, so (given that I’m not measuring the loudness of my voice), that seems about right.

I’ll have to have students read about sound pressure level, loudness, and decibels for them to be able to understand how to read the spec sheet, so these calculations should be put between the microphone lab and the first amplifier lab.  I’ll have them measure peak-to-peak amplitude for speech, and we’ll compare it (after the lab) with the spec sheet.  This could be introduced as part of a bigger lesson on reading spec sheets—particularly how reading and understanding specs can save a lot of empirical testing.


2013 July 10

FFT on ATMega and BitScope

Yesterday, my son was thinking of adding a microphone to the design he is working on, and was considering adding a fast Fourier transform (FFT) to detect pitch.

He spent a few hours after his 10 a.m.–5 p.m. theater class reading about the FFT algorithm. He found an implementation of the FFT for an Arduino, which he tried reading along with the FFT explanations he found on the web.  I’m actually surprised the the Arduino was capable of doing an FFT, given the slowness of the processor.  It is true that the example code only does a 64-sample FFT with a sampling rate of 1kHz, using 8-bit samples and 16-bit integer arithmetic, but it is reported to do it at better than 10 FFTs per second.

I also pointed him to the Discrete Cosine Transform (DCT), which has somewhat smaller boundary artifacts, and can be computed about twice as fast, but he hasn’t had time to read that yet.  Somewhat surprisingly the DCT article in Wikipedia much better written than the general one on Fourier Transforms, which uses awkward notation and a rather dry, formal factoid dump.

I wanted to show him that FFT did not make pitch extraction trivial (at least not in real musical contexts), so I wired up a microphone and amplifier to my BitScope Pocket Analyzer and we turned on some Internet radio (our local public radio station, KUSP).  The complex mass of rapidly shifting peaks in the FFT made it clear that tracking a pitch would not be easy.  (I think that there are some useful pitch-extraction algorithms that are based on FFT, but they are not trivial.) I think I convinced him that he is better off trying to extract loudness than pitch, if he wants a useful control parameter for his device.

Incidentally, he spent some time yesterday looking for cheap electret microphones. There are quite a few on the market, but many of them say “hand solder only” on the datasheets—even some of the ones with just solder pads! There are mics that can be reflow soldered, but finding prices for them in the 100s is difficult—they mostly seem to be quotes from the manufacturers only. One promising one is the SiSonic SPQ2410HR5H-PD, which is only  3.76mm by 2.24mm and uses a ball grid array (it costs 92¢ in 100s, substantially more than 57¢ for the cheapest through-hole mic (though that needs to be hand soldered). CORRECTION 2013 July 10—that’s a MEMS silicon mic, not an electret.

We looked at digital mics that do the A-to-D conversion already, but the only one with a useful output format was the ADMP441, which costs $4.52 in 100s (way too expensive). The cheaper (down to about $1.02) digital mics all use PDM (pulse-density modulation), but to get that into a usable form inside the ATMega, he’d have to low-pass filter it and pass it through the A/D converter. Still, that may not be any more expensive than an analog mic, DC-blocking high-pass filter, and amplifier, though using a separate amplifier would let him design for the proper microphone sensitivity.  He’s going to have to figure out whether the board area and parts cost are worth the extra functionality of the microphone.  If the board area is not a problem, he could design the mic in, but then have the devices only partially populated to save parts costs, if necessary.

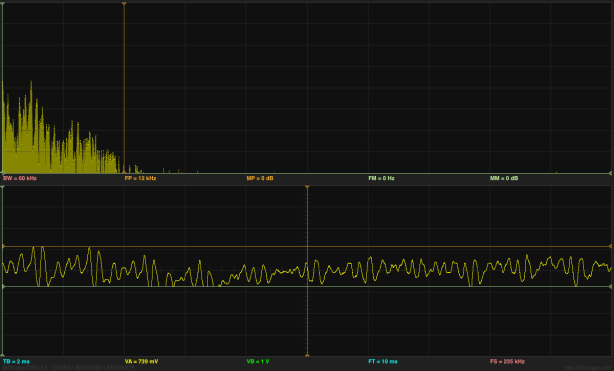
We also noticed that we could tell the bandwidth of the radio station we were listening to, because there was a very clear drop in the spectrum at 10kHz.  I tried capturing that this afternoon, but the station we listened to had a talk program rather than a music program, and I never captured a moment when they were using the full bandwidth.  I tried a different Internet music source, and got the following plot, which seemed to indicate a 12kHz bandwidth, but that may have been limited by the music recording they were playing, rather than the codec used for transmission over the internet.

Snapshot of FFT showing a bandwidth of about 12kHz.  The grid for the spectrum is 10dB per division vertically and

Snapshot of FFT showing a bandwidth of about 12kHz. The grid for the spectrum is 10dB per division vertically and 6kHz per division horizontally.

Before we’d played with sound input, we’d looked at sine waves generated by the BitScope, by connecting a wire from the GEN output to the CHA input. I don’t think I was able to explain to him why the windowing function used for removing boundary artifacts in the FFT results in spreading the single-frequency spikes into wider peaks. It was too late at night to go into the theory of transforms and how multiplication in the time domain turns into convolution in the frequency domain, and vice versa. For that matter, he hasn’t even had convolution yet, so some of the fundamentals needed for the explanation were missing.

At one point I thought that the FFT on the Bitscope was a crude rectangular window, but I was informed by the Bitscope people that they use a Kaiser window. I should have been able to tell that they were doing some sort of windowing by seeing the spread of the spikes for sine waves, but I wouldn’t have been able to guess which window. (It may be buried in the documentation somewhere.) Actually, now that I look at the spikes, they seem too wide for a Kaiser window, unless they set the α parameter much too large.  They only need the sidelobes to be about 60dB down, which should be a much narrower main lobe—not the 18-bin width I think I’m seeing. Perhaps there is something else spreading the peaks, not just the Kaiser window.

Sine wave and FFT analysis of it. Note the harmonic distortion (2nd, 3rd, and 4th harmonic)

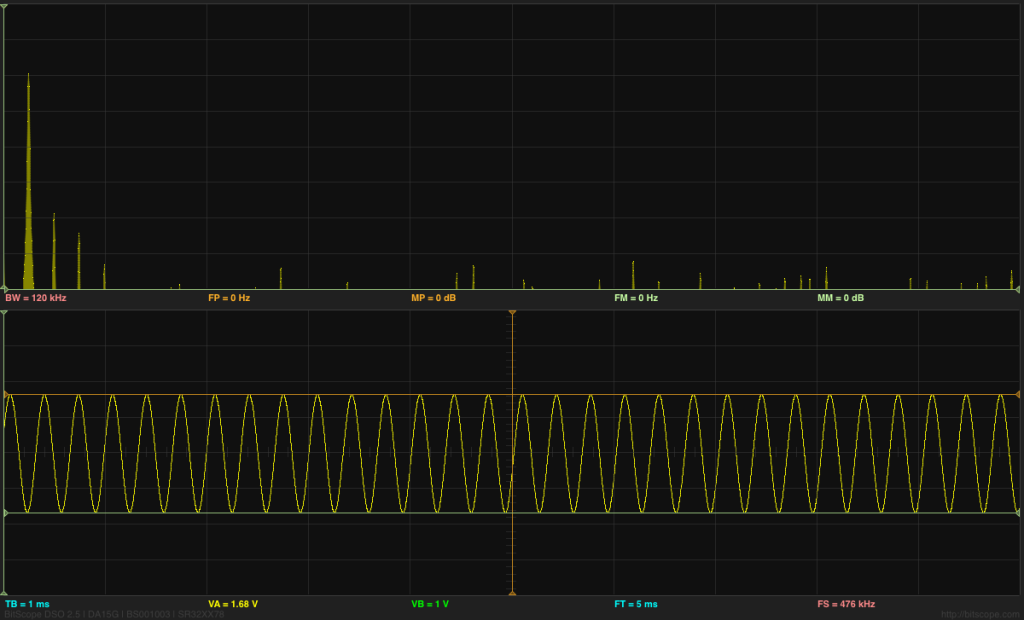
Sine wave and FFT analysis of it (Click on image for larger, clearer picture). Note the harmonic distortion (2nd, 3rd, and 4th harmonic at about –40dB, –45dB, and —53dB).
Good luck figuring out the settings of the Bitscope from the information they show on the display!  TB is the time per division on the x-axis of the plot, while BW=120kHz is the full width of the spectrum (so 12kHz per division), and the sine wave is at about 3kHz.

It is interesting to look a a sine wave that is an exact submultiple of the sampling frequency:

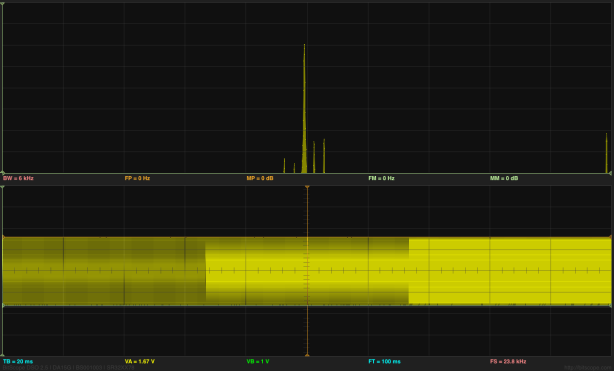
Here is a 2975Hz sine wave, where each period should be 8 samples long.  Note the appearance of side bands to either side of the main peak.  These artifacts are much smaller if we move to a frequency that does not fit so neatly into the FFT buffer.

Here is a 2975Hz sine wave, where each period should be 8 samples long. Note the appearance of side bands to either side of the main peak. These artifacts are much smaller if we move to a frequency that does not fit so neatly into the FFT buffer.
Note that the time base is different for this screenshot (20ms/division).

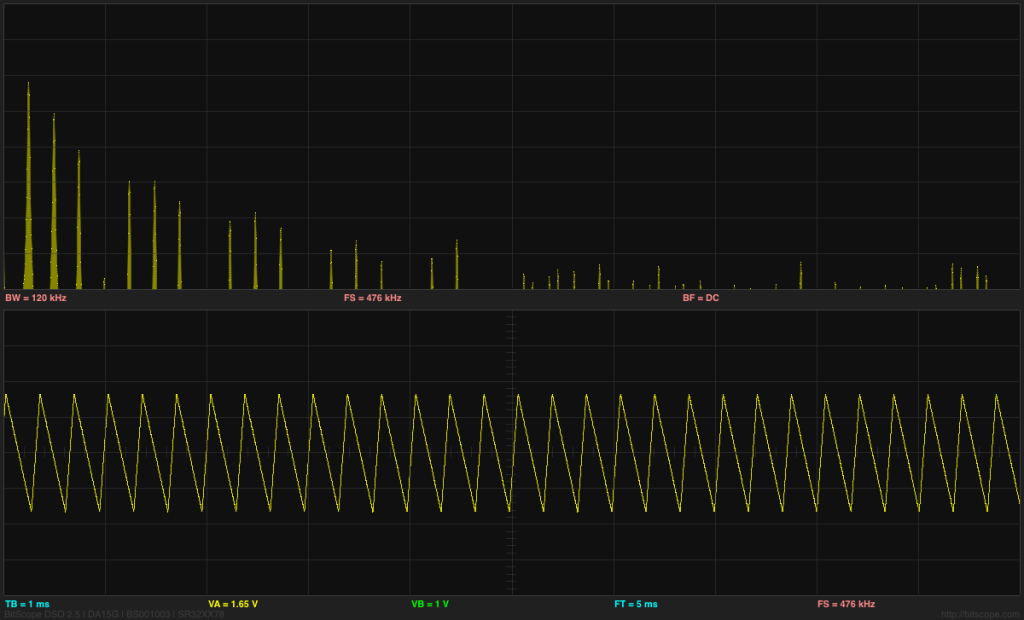
We also looked at the spectra of triangle waves and square waves (since the BitScope waveform generator can do those also). Playing with the duty cycle was fun also. I had not been aware that a duty cycle of 1/n on a square wave or triangle wave suppressed the nth, 2nth, 3nth, … harmonics. I had known that a 50% duty cycle square wave or triangle wave suppressed the even harmonics, but I had never thought about other duty cycles.

Triangle wave with 25% duty cycle, showing suppression of the 4th, 8th, 12th, and 16th harmonics.

Triangle wave with 25% duty cycle, showing suppression of the 4th, 8th, 12th, and 16th harmonics.

Next Page »